
Current project version: 2.1
The AKVEG Map is a suite of geospatial datasets that represent specific vegetation characteristics. Most users will likely find the categorical map of vegetation types best suited to their needs and easiest to visually interpret. We recommend statistical analyses rely on the continuous or time-series foliar cover maps. Available data products are listed below:
- Existing vegetation types (categorical vegetation map)
- Biomes and vegetation regions of Alaska and adjacent Canada
- Continuous foliar cover maps of diagnostic species sets
- Time-series foliar cover maps of plant functional types (1985-2020)
- Surficial features
We are in the process of curating data for AKVEG v2.1 in the NSF Arctic Data Center. In the meantime, data are available for download through our hosted services.
Existing vegetation types
Download raster map of vegetation types (~ 1.9 gb) or explore online
Vegetation types are discrete, interpreted simplifications of continuous gradients of floristic composition (see example plot below). The AKVEG categorical map delineates the spatial distributions of vegetation types aligned with the U.S. National Vegetation Classification (USNVC), providing a standardized summary of major patterns of vegetation community composition and structure. The USNVC is a hierarchical system of nested type relationships across coarsening ecological scales; therefore, attributes in the AKVEG categorical map also correspond to multiple ecological scales. The “MAP_CLS” (map class) attribute delineates the finest level of ecological detail in this map, ranging between “alliances” and “groups” defined according to the USNVC. The “NVC_GROUP” (group) and “NVC_MACRO” (macrogroup) attributes define the relationships of the mapped types to coarser ecological scales. (Note: Full coverage of Southeast Alaska and adjacent Canada is currently in development and will be added in a future release.)
This data package also contains a layer file for simplified peatland and wetland types. The criteria for these types are based on the USNVC, which emphasizes typical peak growing season water regime at the soil surface.
- Raster (.tif) where raster values represent categorical types
- Resolution: 10 m
- Minimum Mapping Unit: 3,000 m2 (0.75 acres)
- Time Period: circa 2020-2023 (fire boundaries incorporated through 2023)
- Projection: Alaska Albers Equal Area Conic (EPSG:3338)
- Access the map classification schema
- Map class descriptions coming in Q2 2027 (see prototype example)
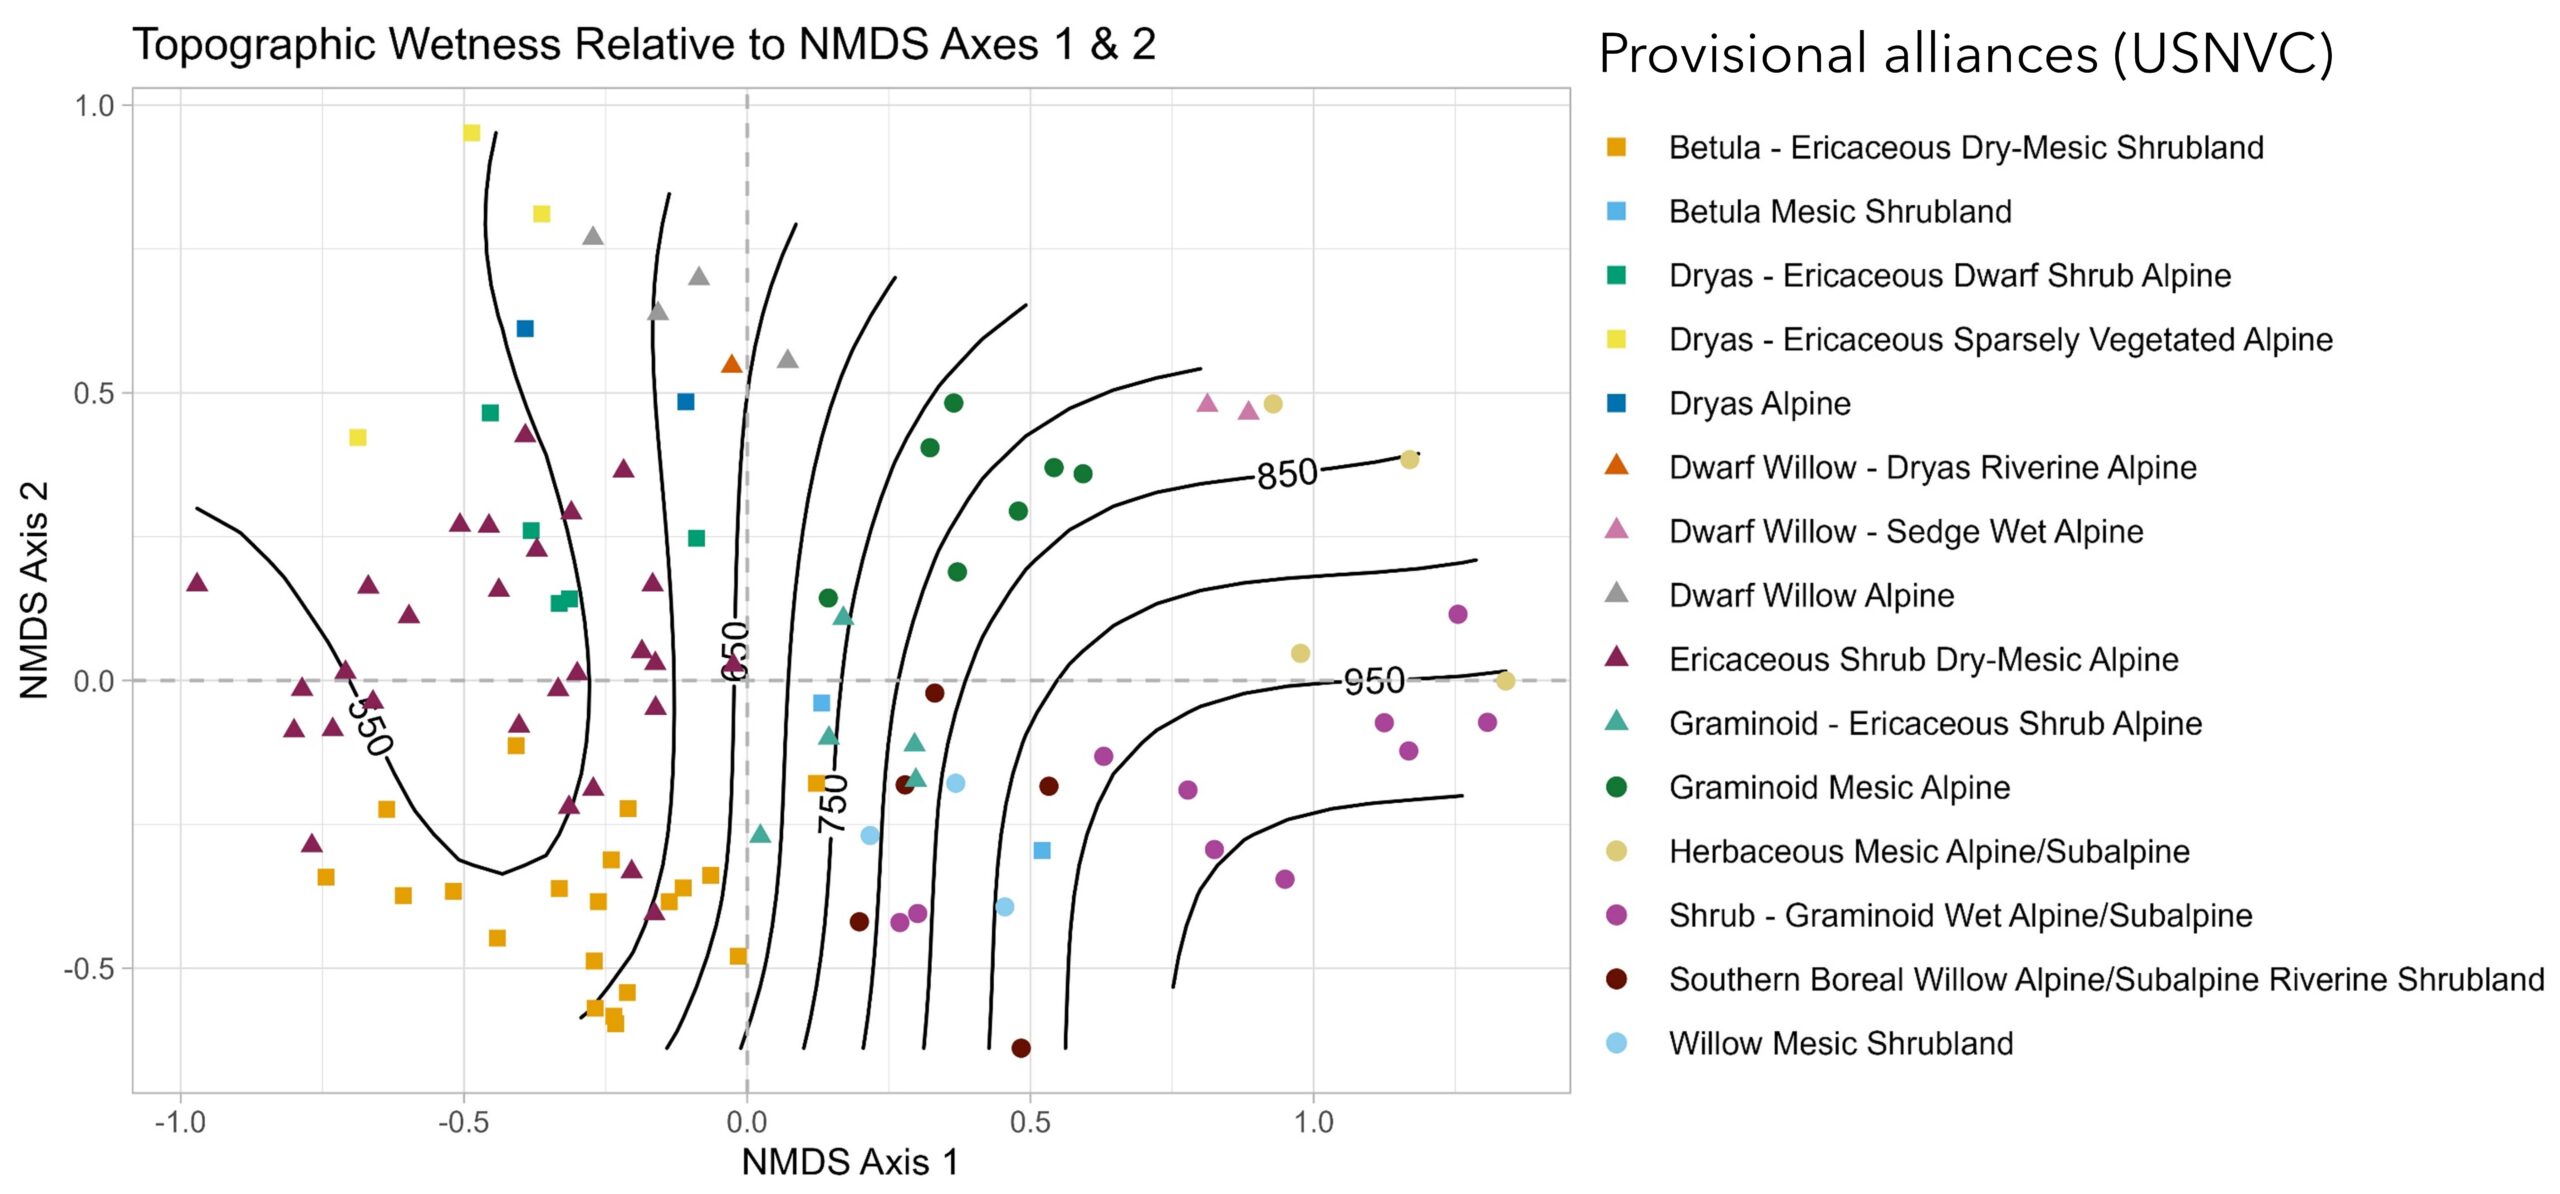
The example plot above shows a flattened 2-dimensional representation of floristic variation in 3-dimensions that distinguishes vegetation types. The numbered lines within the plot show topographic wetness (larger numbers represent wetter sites), demonstrating the relationship of types to environmental gradients.
Bioclimatic zones and vegetation regions
Download zones and regions dataset through NSF Arctic Data Portal (~ 3 mb)
This vector map delineates generalized geographies for bioclimatic zones and vegetation regions referenced in the U.S. National Vegetation Classification (USNVC) across Alaska and adjacent Canada. The geographies defined by this dataset provide a link between the non-spatial USNVC and the categorical map representing distributions of USNVC types. Bioclimatic zones summarize major environmental drivers of ecological variation at a subcontinental scale (corresponding to macrogroups and coarser types in the USNVC), while vegetation regions summarize major biogeographic patterns at a regional scale (corresponding to macrogroups and finer types). This dataset delineates four bioclimatic zones (Arctic, boreal, northern subpolar oceanic, and temperate), which are further subdivided into ten vegetation regions.
- Shapefile (.shp) containing polygon features
- Projection: Alaska Albers Equal Area Conic (EPSG:3338)
- Description of processing considerations detailed in data record and metadata
Continuous foliar cover of diagnostic species sets
Download data package for continuous foliar cover (~ 142 gb)
Diagnostic species are those that distinguish one or more vegetation types by their occurrence or abundance. We mapped the abundance of sets of ecologically similar diagnostic species with one raster per mapped diagnostic species set. Raster values integers ranging from 0 to 100% that represent absolute foliar cover, the proportion of ground area covered by the included taxa across all canopy strata. Mapped diagnostic species sets vary from individual species (e.g., tussock cottongrass) to multiple ecologically similar species (e.g., wetland sedges). In combination, these maps form overlapping gradients of community composition and structure; thus, they represent biotic and environmental gradients indicated by constituent taxa of the sets. In addition to the foliar cover maps, we also mapped probability of occurrence (i.e., distribution probability) for six (6) additional diagnostic species sets that were not appropriate to represent as foliar cover because of either: 1) their rarity in our available field training observations, or 2) their typical low abundance.
- Raster (.tif) where raster values represent foliar cover (0-100)
- Resolution: 10 m
- Time Period: circa 2020-2023 (captures disturbances prior to 2021)
- Projection: Alaska Albers Equal Area Conic (EPSG:3338)
- A manuscript is currently under review
Time-series foliar cover maps of plant functional types
Download time-series data through NASA EarthData (requires free account)
Plant functional types are broad groupings of plant species based on structural and leaf characteristics (e.g., deciduous shrubs). The time-series foliar cover maps include one raster per plant functional type per five-year time period from 1985 through 2020. Raster values represent top foliar cover, the proportion of ground area covered by the included taxa in the uppermost canopy strata.
- Raster (.tif) where raster values represent top foliar cover (0-100)
- Resolution: 30 m
- Time Span: 1985-2020 at five-year intervals
- Projection: Canada Albers Equal Area Conic (EPSG:102001)
- For more information, see the associated publication: Macander et al. 2022
Surficial features
Surficial features represent the spatial distribution of abiotic land cover types (e.g., persistent water), disturbance states (e.g., burn by year), or depositional and disturbance regimes (e.g., floodplains). In turn, such data can be interpreted to represent characteristics of vegetation, such as successional state or unique plant communities.
We are currently in the process of making the surficial feature data available. In the meantime, please contact us with specific requests.